丁育頡 研究成果刊登工學院簡訊
丁育頡*, D. Liu, W.T. Morgan, J.D. Allan, H. Coe, C. Li, X. Wang, X. Ye and J. Chen: Characterising Black Carbon and Gaseous Pollutants on the Yangtze River across Eastern China Continent, Journal of Geophysical Research: Atmosphere, DOI: 10.1029/2020JD033488 (Accepted, February 2021)
The Yangtze River region and cities along the river have severe deterioration of air quality due to urbanization and economic development. Black carbon (BC) has significant impacts on air quality and climate, however it is poorly characterised across the region. Here we report the first continuous measurements of BC and gaseous pollutants along the Yangtze River in wintertime, with an intensive observation period from 21 November to 4 December 2015, covering ~7° longitude over the continent in China. The highly polluted periods (HPP) with NOx > 80 μg m-3 correlated with high SO2 > 10 μg m-3, which indicated more localized emissions. At the western (longitude < 118°E) and eastern (longitude > 118°E) ends of the Yangtze river valley, the HPP events reduced, mostly since the western end was influenced by terrain height and regional transport, and the eastern end was influenced by easterly oceanic or westerly continental air masses. In these regions, BC core size decreased by 5-19% during the HPP, and had modes of mass median diameter in the range 120-180 nm, which was found to be predominately from local sources, contrasting with a more consistent mode ~200 nm that was due to BC from mixed sources. A comparison of simultaneously measured data from the nearby monitoring stations along the river demonstrated a high consistency of PM2.5 over the river, which reflected the important regional impact on the particulate mass. This study evaluates the shipping emission and regional influence over the Yangtze River and may guide the policy making on mitigating air pollution. (環工所丁育頡教授提供)
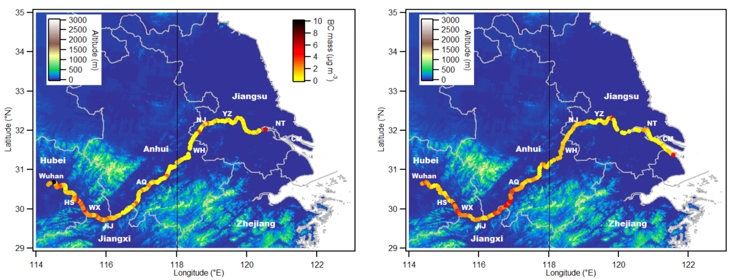
Figure 1. Spatial distribution of BC mass median concentrations back and forth between Shanghai and Wuhan along the Yangtze River from 22/11/2015 to 04/12/2015. Left: departing journey (Shanghai to Wuhan); right: returning journey (Wuhan to Shanghai).
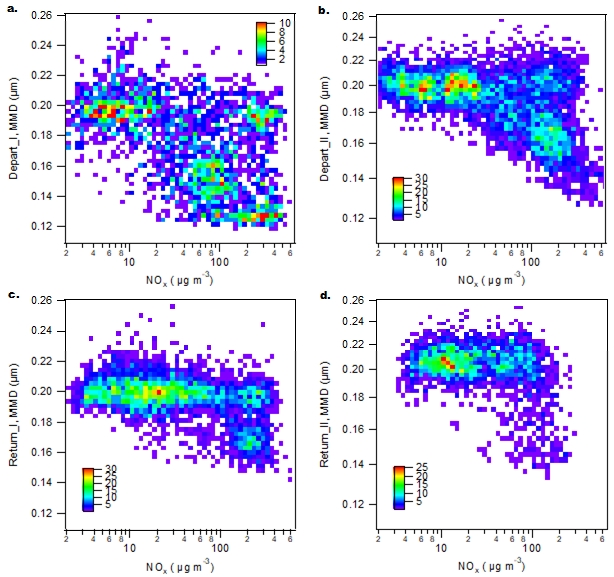
Figure 2. The distribution of BC core mass median diameter as a function of NOx. a) depart_I. b) depart_II. c) return_I. d) return_II. The color scale represents the BC particle number concentration.
資料來源
http://sub.eng.ntu.edu.tw/eng/newsletter/2021/247/News_Content_n_63065_sms_62965_s_79319.html